
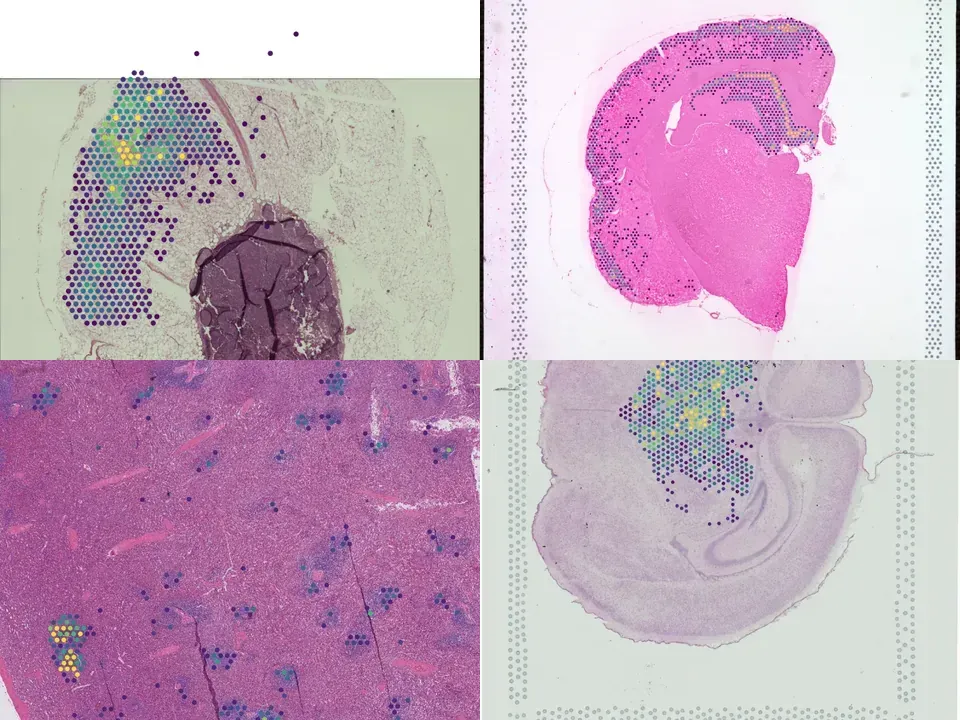
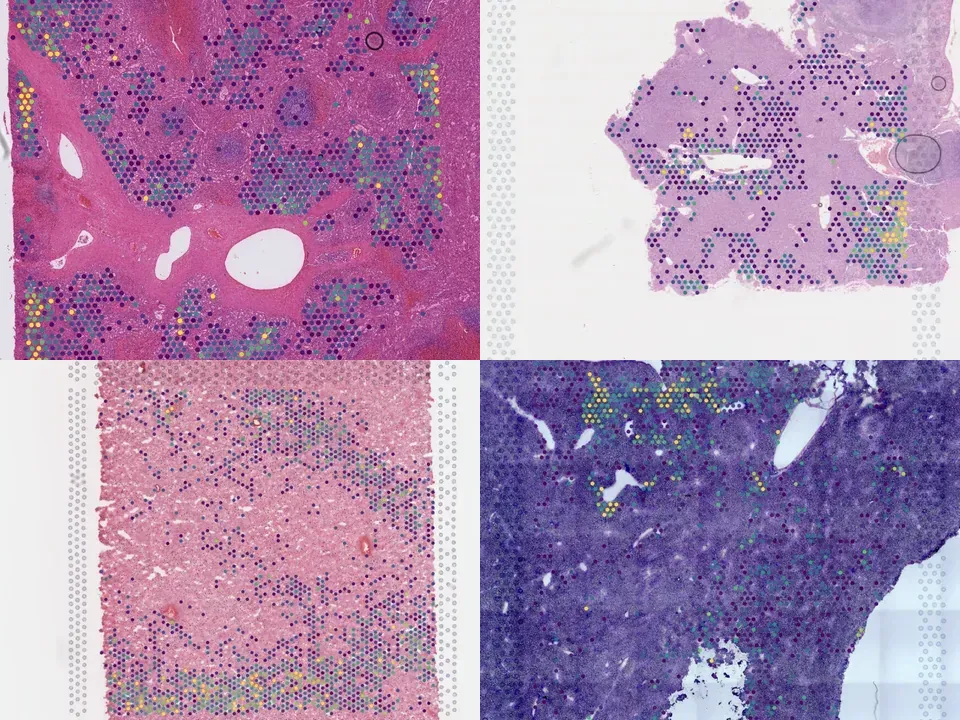
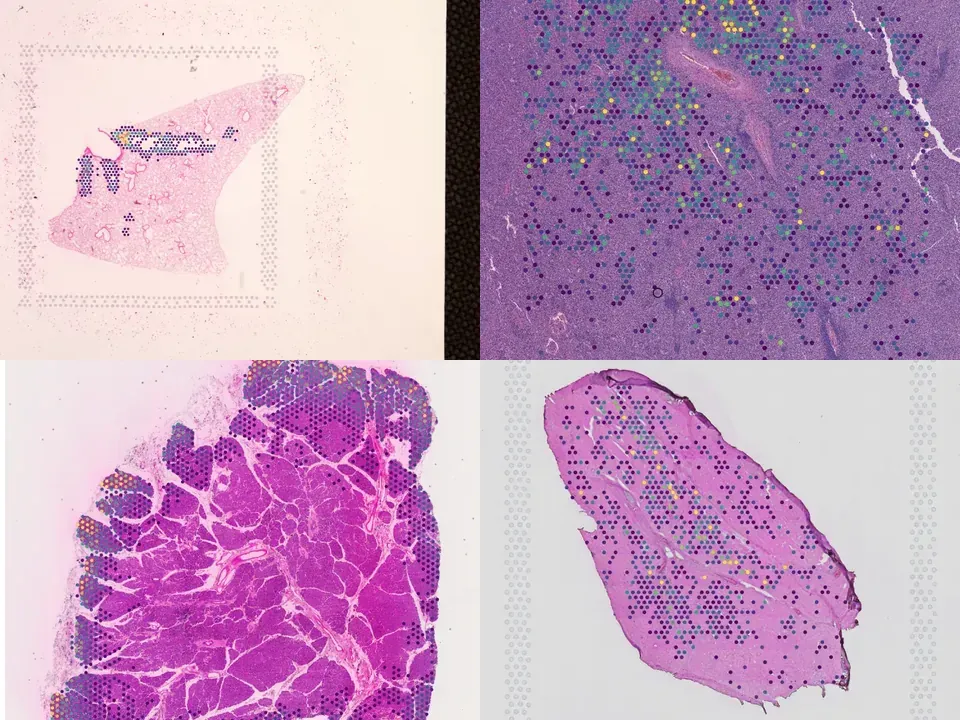
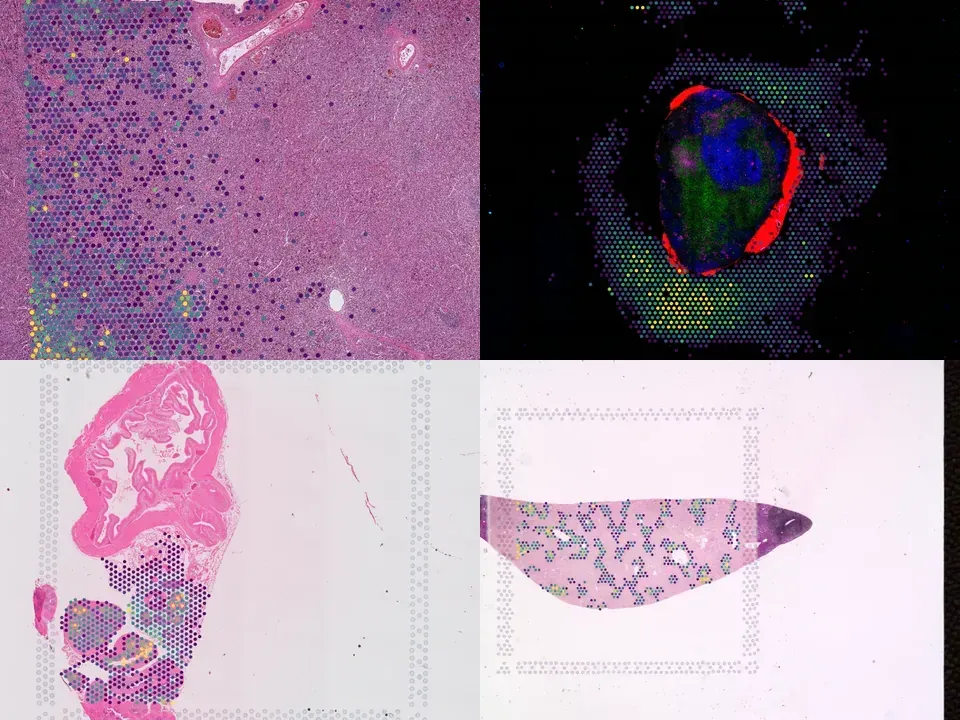
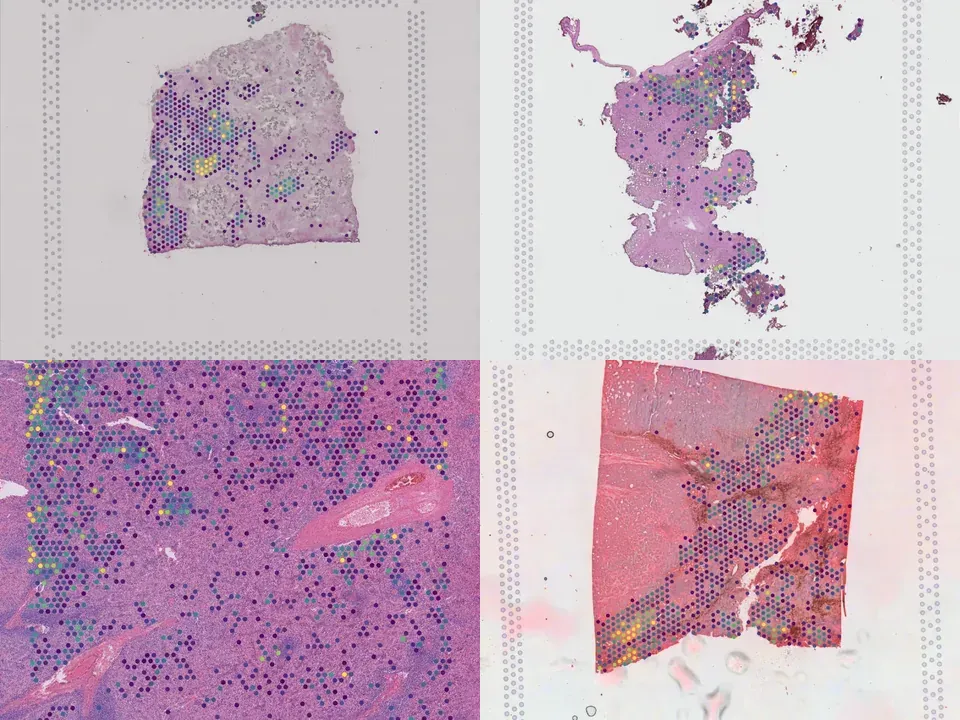
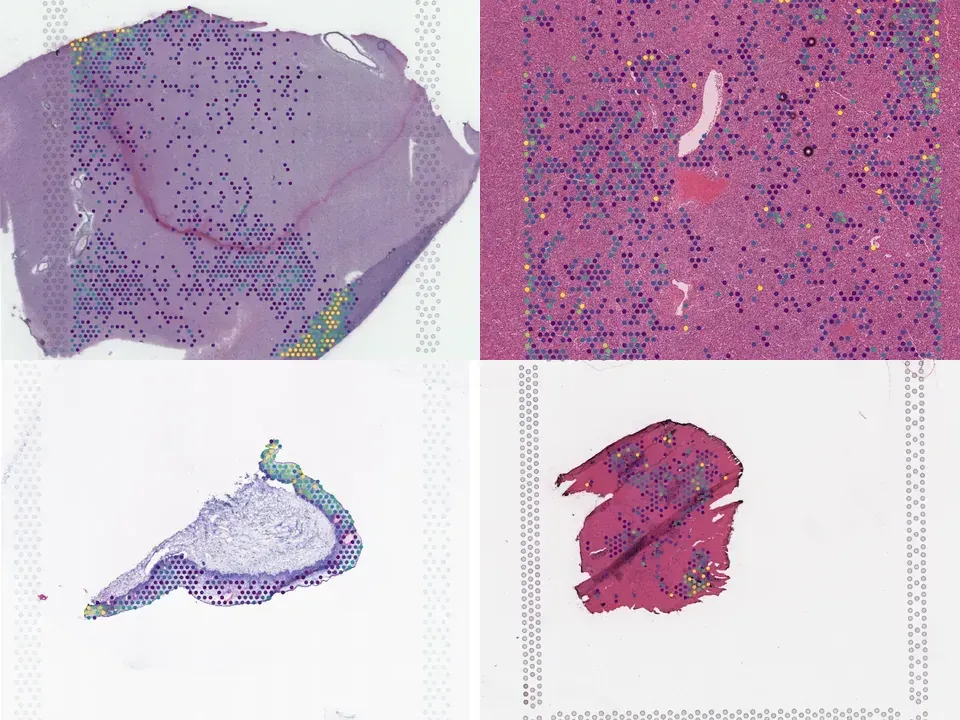
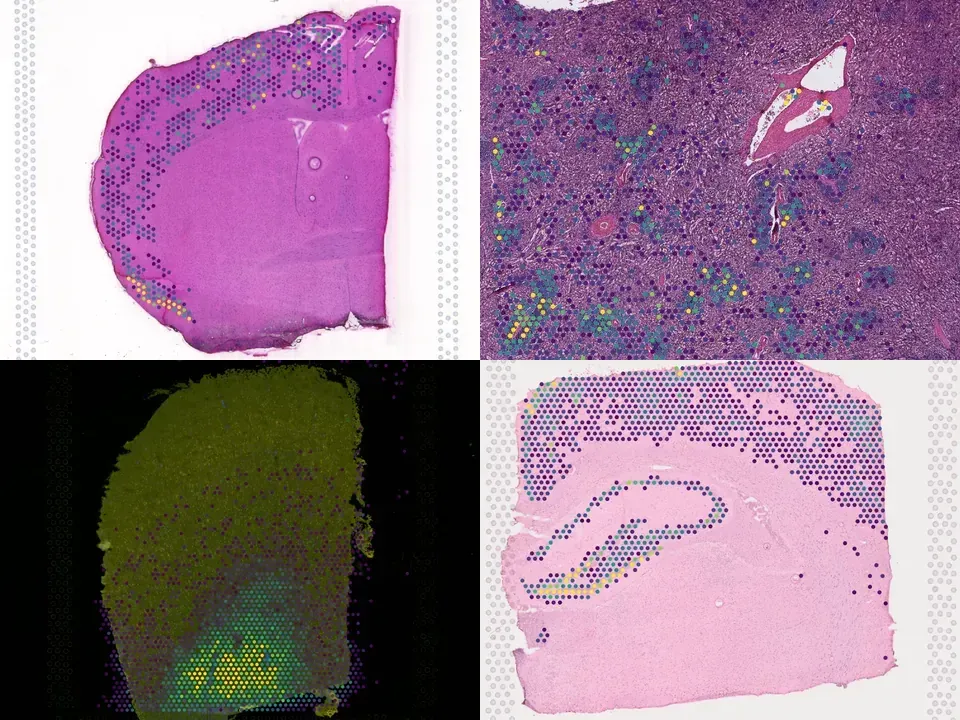
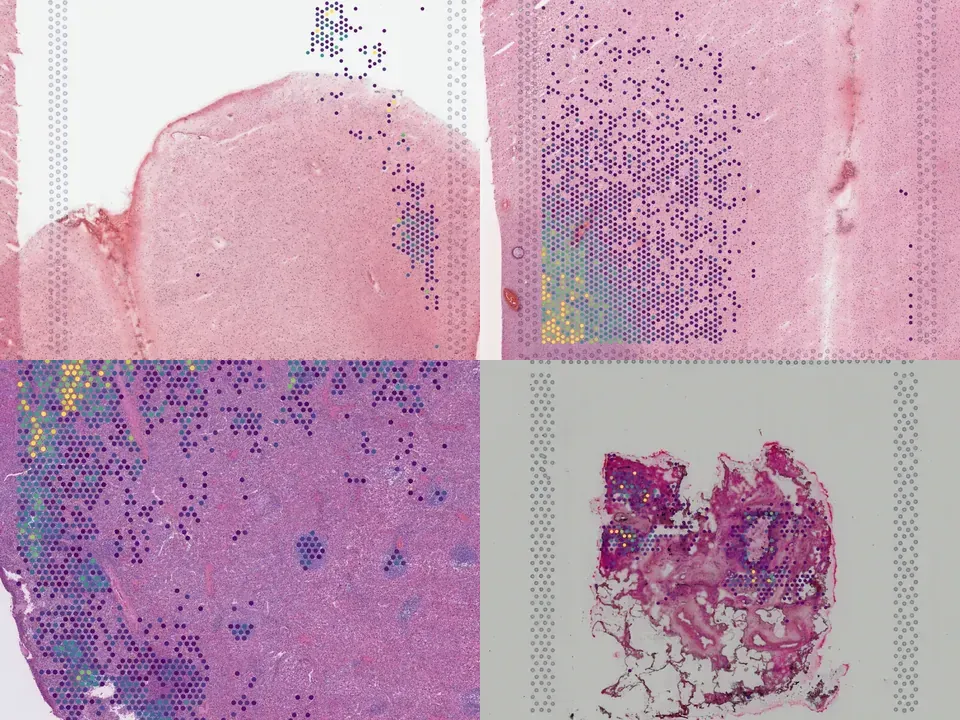
Human spleen
GSM9750810
human spleen 30.6 MB 4,988 spots silver H&E NCBI GEO policy
TechnologyVisium
Organismhuman
Tissuespleen
Spots4,988
silver H&E NCBI GEO policy
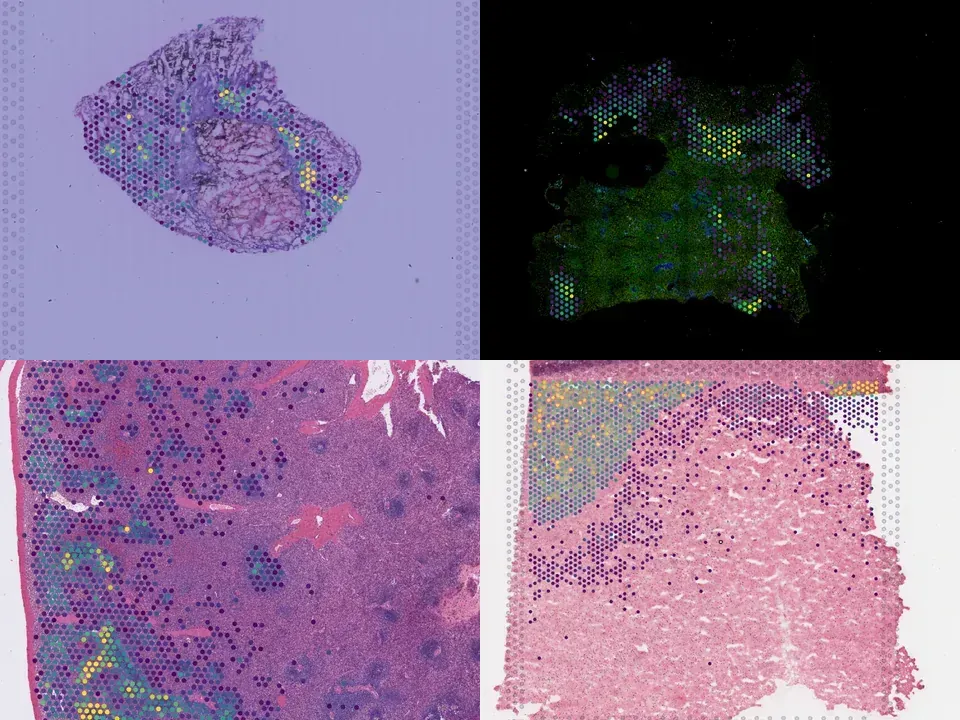
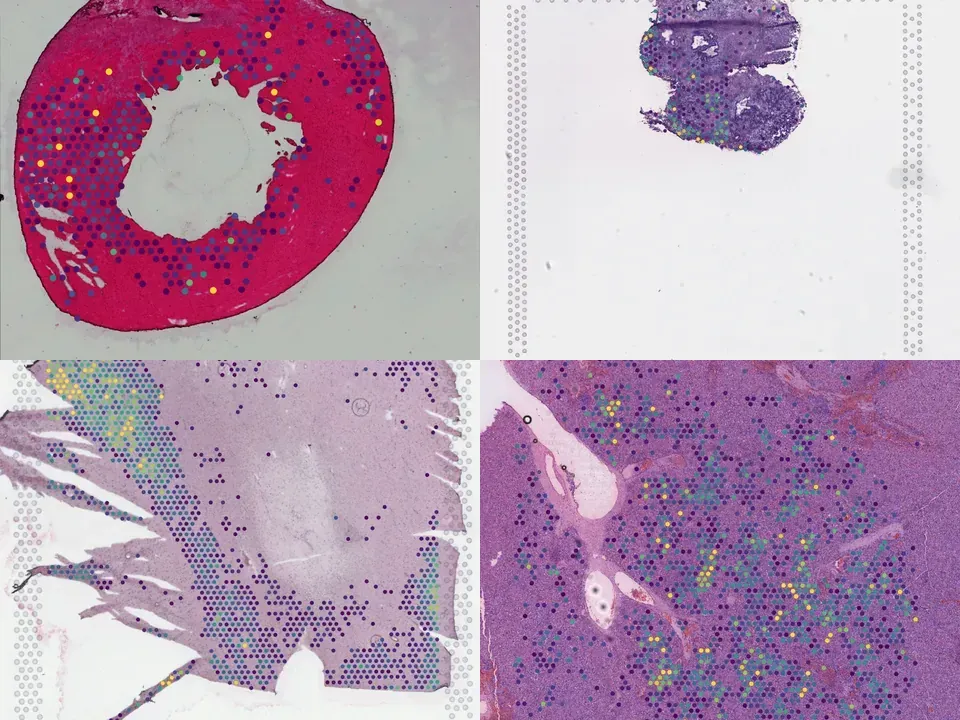
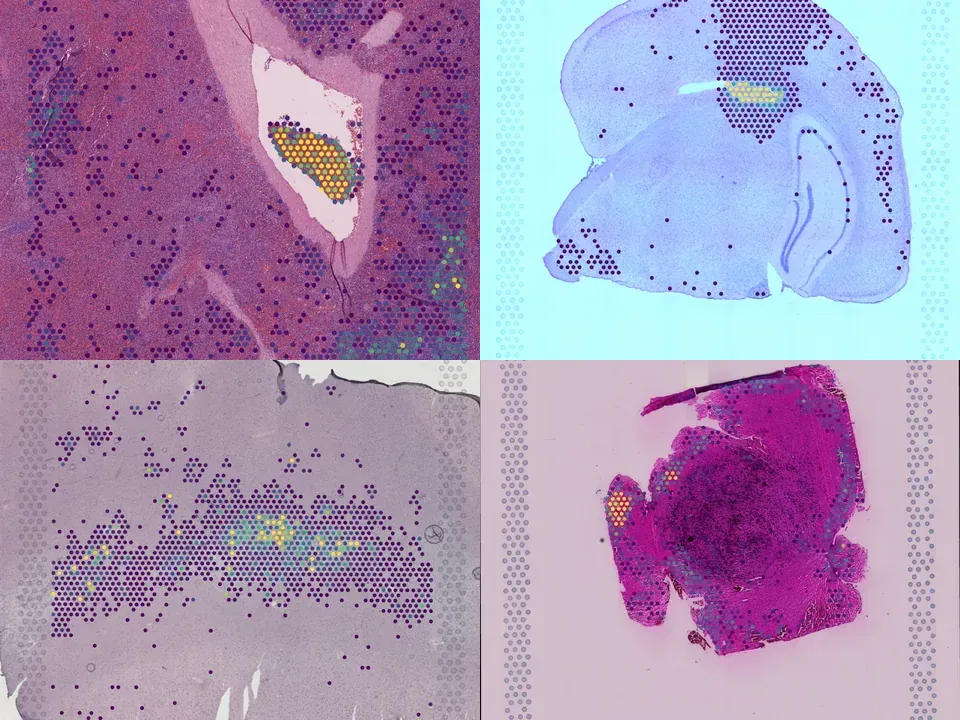
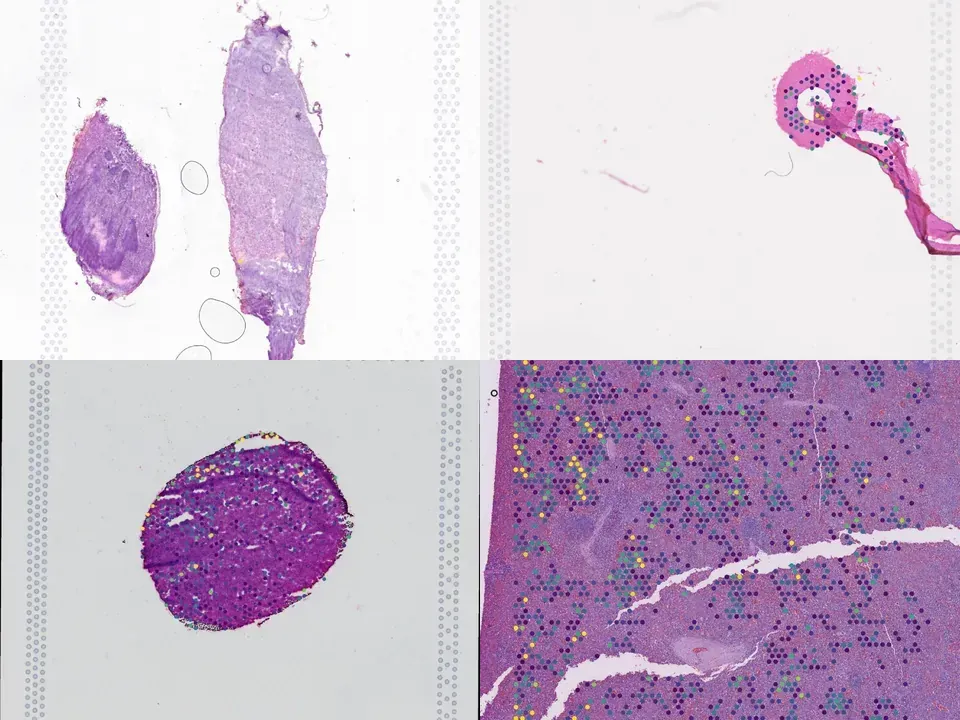
Splenomegaly is a defining feature of myelofibrosis, yet the contribution of splenic mesenchymal stroma to disease progression remains unclear. We combined spatial and single-nucleus transcriptomics of patient spleens to map extramedullary hematopoiesis niches. Activated red pulp reticular cells localize near hematopoietic stem and progenitor cells, and early disease shows marginal zone disruption with lymphoid depletion preceding stromal remodeling. Macrophage- and megakaryocyte-derived signals activate complement and induce TNFα, TGF-β, extracellular matrix, and Thbs1 programs in reticular cells.
from sddb import Catalog

cohort = Catalog().collection("geo-gse332563")
cohort.members        # the 12 datasets as a table

print(cohort.licenses())              # check the terms before you download

sdatas = cohort.to_dict()             # {uid: SpatialData}, cached locally
# or keep the .zarr files in a folder of your choice:
# sdatas = cohort.to_dict(dest="data/")Needs pip install lamindb and network access to the Lamin database, which is limited during the alpha. If it fails, use the Client tab.
import lamindb as ln

db = ln.DB("scverse/spatialdata-db")
coll = db.Collection.get(key="geo-gse332563")
coll.ordered_artifacts.to_dataframe()   # the 12 members, ordered

# download every member .zarr to the local cache:
paths = [a.cache() for a in coll.ordered_artifacts.all()]# sddb client: download every member .zarr into data/
sddb-cli download --collection geo-gse332563 --dest data/Licenses: 12 NCBI GEO policy
No linked publication found — please cite the data source.